


Data Visualization and Reporting
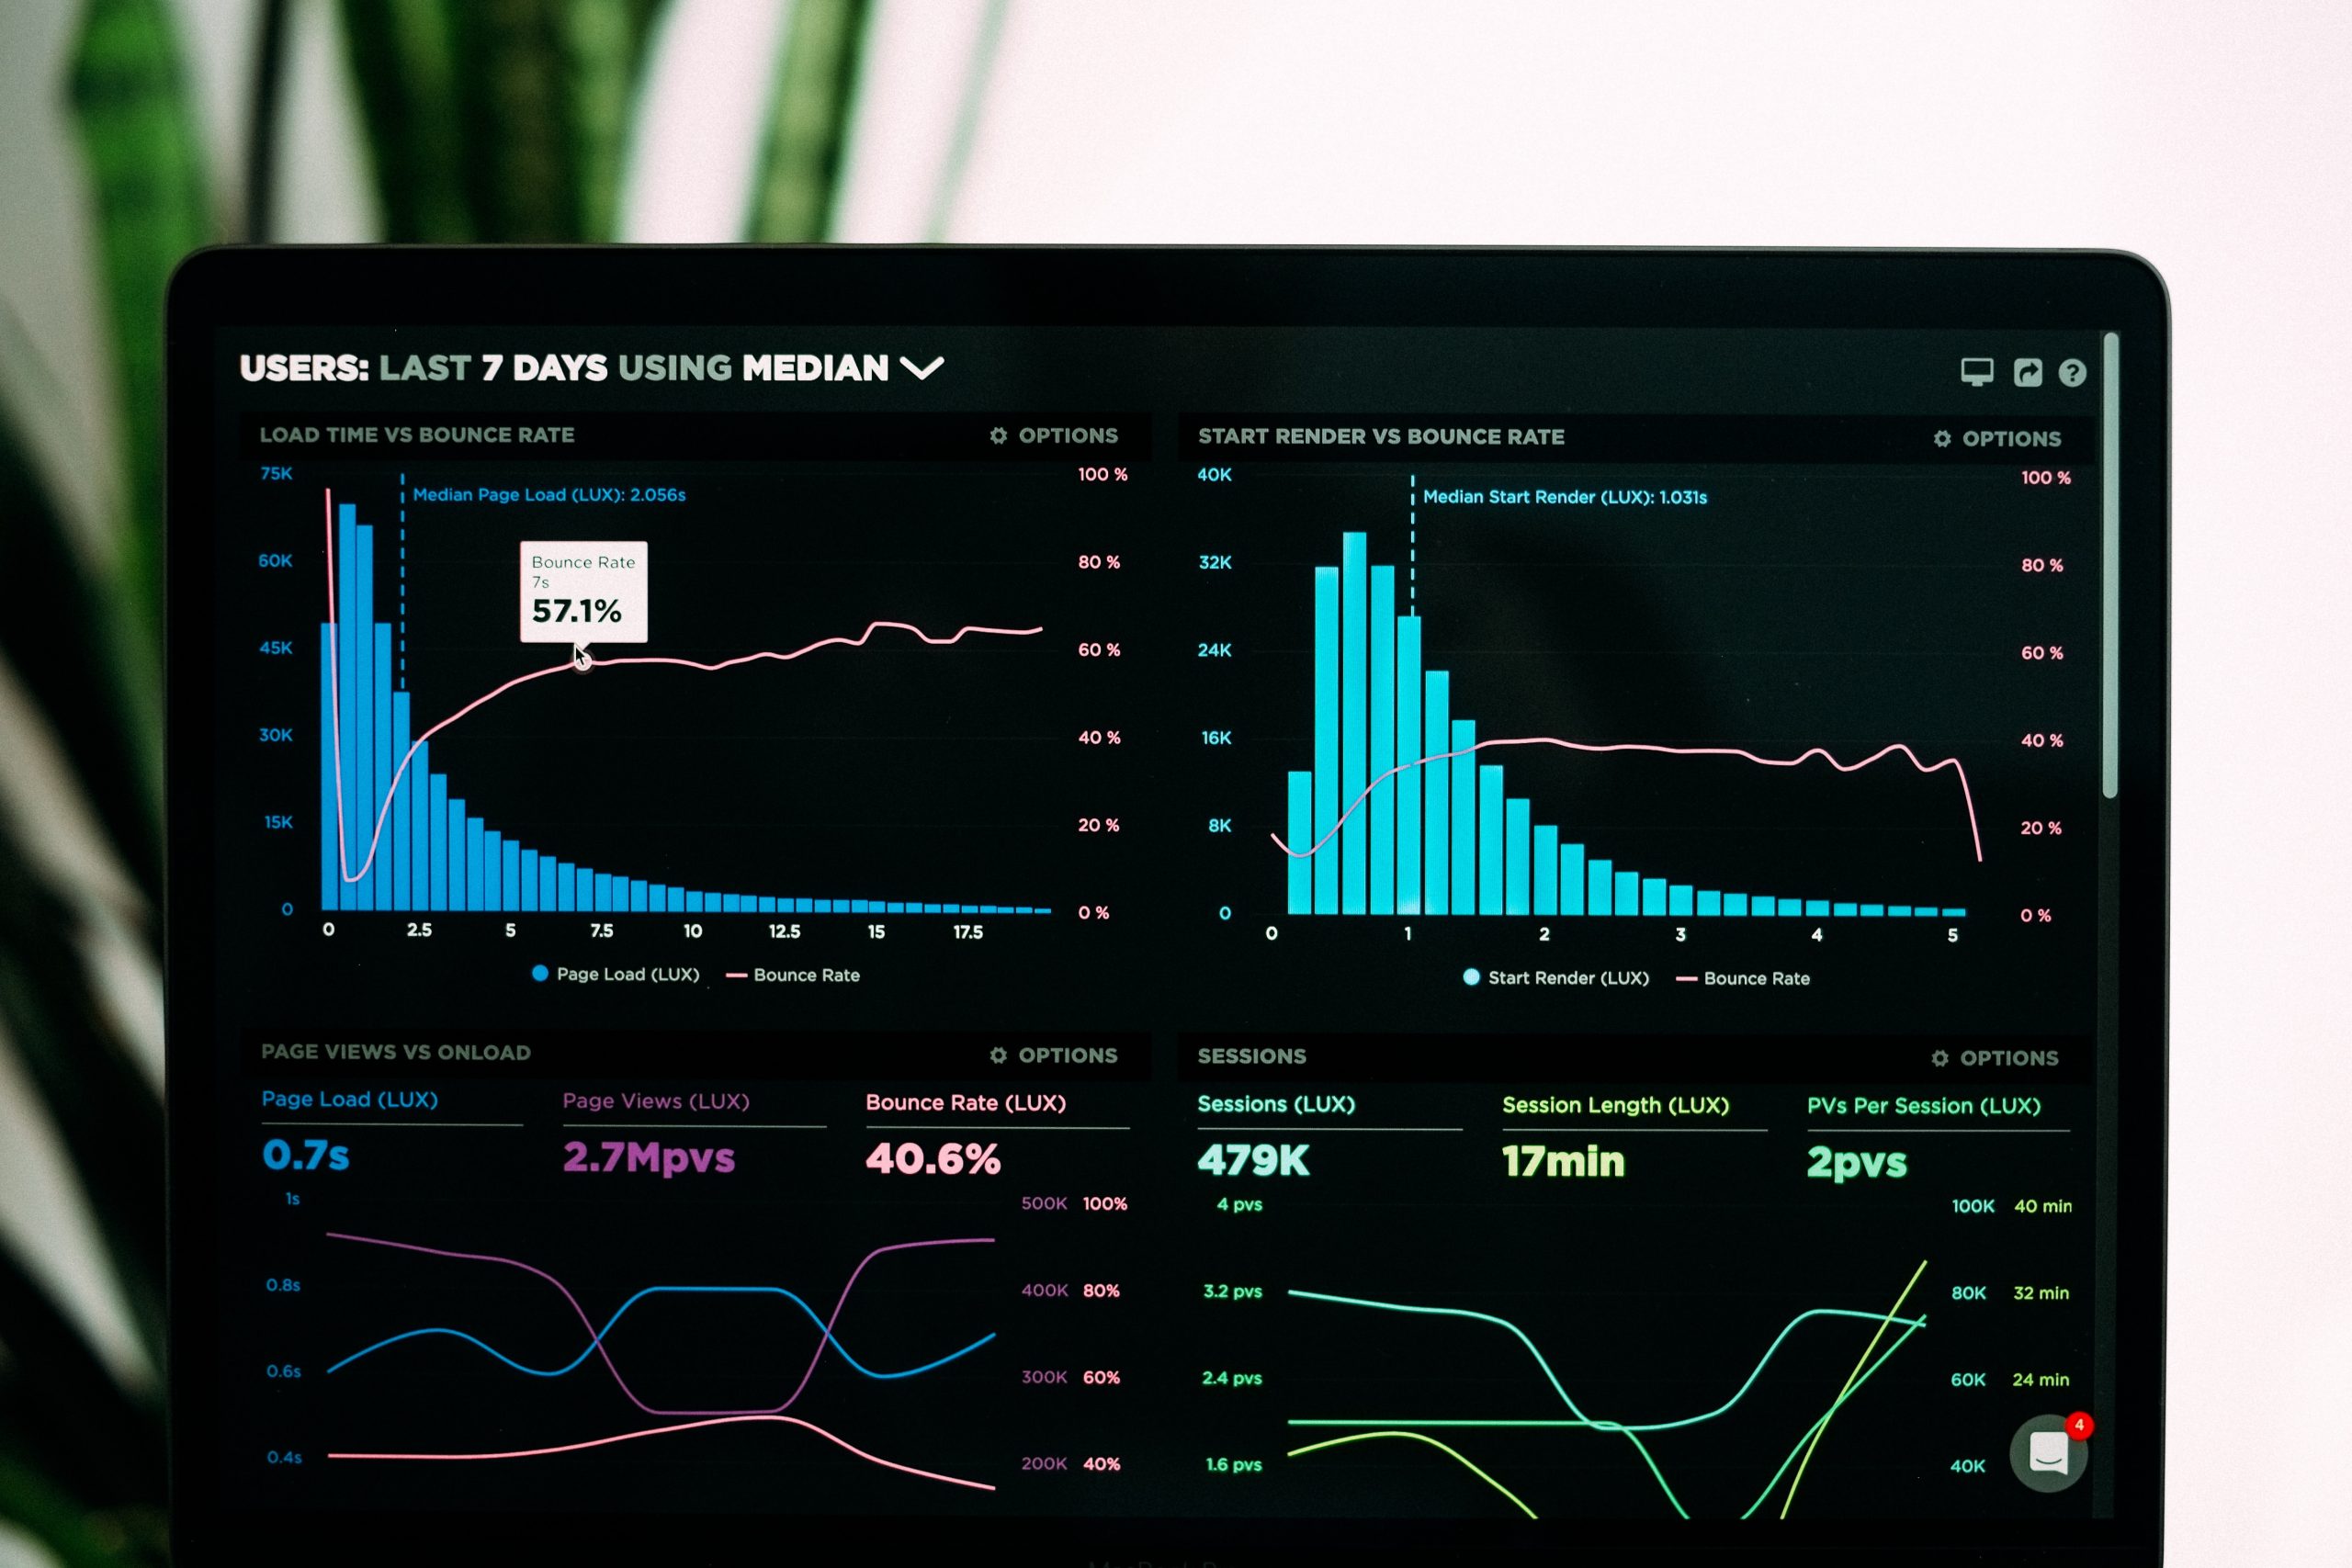
See your data come alive with our Data Visualization and Reporting service. Create custom dashboards and interactive reports to explore real-time data updates.
Export and share insights with stakeholders, fostering a data-driven decision-making culture within your organization
- Custom Dashboards
- Real-time Data Updates
- Interactive Reports
- Export and Sharing
- Multi-platform Compatibility
- Data Storytelling

See Your Data Come Alive
Data Visualization and Reporting bring your data to life through clear and intuitive visuals. Our interactive dashboards and insightful reports present complex data in a way that is easy to understand and act upon. Empower your stakeholders with dynamic data visualizations that reveal trends, correlations, and opportunities in real-time.
From operational KPIs to executive summaries, our custom reports provide a holistic view of your business’s performance. Seamlessly communicate complex insights with impactful visuals, driving a culture of data-driven decision-making across your organization